 Google
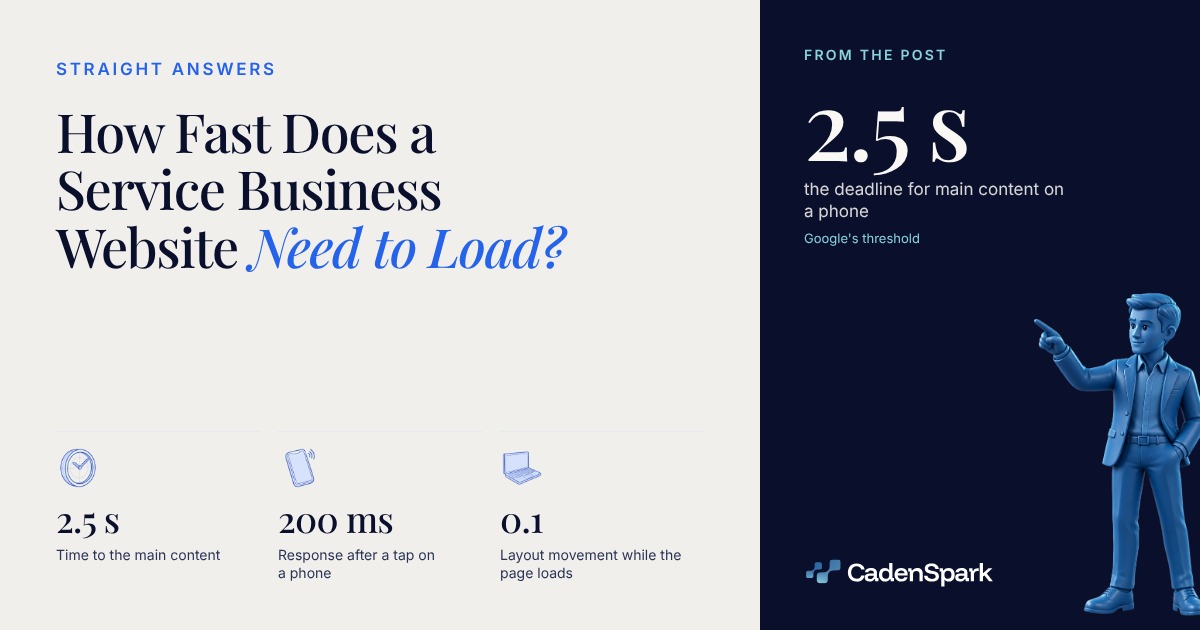
2.5 seconds. That is Google’s published threshold for the main content of a page to appear, and it has to hold for at least 75% of real visits. On mobile, 48% of sites clear all three vitals (HTTP Archive, 2025).
How fast does a website need to load?
Three numbers, and all three are required: main content within 2.5 seconds, a response to a tap within 200 milliseconds, and layout movement under 0.1. They are scored on real Chrome traffic, not an office test.



Thresholds from Google’s web-vitals library; the 75th-percentile rule from the Web Almanac 2025 performance chapter and Chrome’s own CrUX documentation.
View data
| Step | Value |
|---|---|
| Chrome traffic on your pages | Real visits (field data, not a lab run on an office connection) |
| of those visits | 75th percentile (at least 75% of them have to sit inside the threshold) |
| load, response, layout | All three (two out of three is not a pass) |
| scored separately | Mobile and desktop (a desktop pass says nothing about the phone) |
How fast is a typical site today?
Not fast enough on a phone. 48% of sites pass all three on mobile against 56% on desktop, and the threshold that drags the result down is load time (HTTP Archive, 2025).
HTTP Archive, Web Almanac 2025 · Chrome UX Report, July 2025, millions of websites
View data
| Item | Value |
|---|---|
| Layout shift (CLS) | 81% |
| Tap response (INP) | 77% |
| Load time (LCP) | 62% |
| All three | 48% |
Pass all three vitals
48% on mobile56% on desktop
The same web, scored on two kinds of device.
Good load time
62% on mobile74% on desktop
Poor loads are nearly double on mobile: 13% against 7%.
Good server response
44% on mobile55% on desktop
Good means under 0.8 seconds. 17% of mobile sites are poor.
Pass all three, by page
45% on home pages56% on secondary pages
Mobile. The page most people land on is the slower one.
View data
| Metric | Day zero → target |
|---|---|
| Pass all three vitals | 48% on mobile → 56% on desktop |
| Good load time | 62% on mobile → 74% on desktop |
| Good server response | 44% on mobile → 55% on desktop |
| Pass all three, by page | 45% on home pages → 56% on secondary pages |
What makes a page slow on a phone?
Bytes, and most of them are the image at the top. The median mobile home page ships 2,559 KB, of which 911 KB is images (HTTP Archive, 2025).
HTTP Archive, Web Almanac 2025 · July 2025 crawl. The median total is 2,559 KB; these five categories do not add up to it.
View data
| Item | Value |
|---|---|
| Images | 911KB |
| JavaScript | 632KB |
| Fonts | 122KB |
| CSS | 77KB |
| HTML | 22KB |
Weight is not part of Google’s calculation, and the pass rate still falls as the page gets heavier.
HTTP Archive, Web Almanac 2025 · CrUX at URL level. A correlation, not a cause: the chapter states page weight is not part of the calculation.
View data
| Item | Value |
|---|---|
| Under 1 MB | 57% |
| 1 to 2 MB | 52% |
| 2 to 3 MB | 45% |
| 3 to 4 MB | 38% |
| 4 to 5 MB | 34% |
| 5 MB or more | 30% |

Does the platform your site is built on decide this?
It sets the floor, not the ceiling. Across selected platforms in the 2025 dataset, mobile pass rates run from 45% to 85%, and every one of them has fast and slow sites inside it.
HTTP Archive, Web Almanac 2025, CMS chapter · five of the ten platforms charted. The chapter’s own note: the goal is not to crown a single fastest CMS.
View data
| Item | Value |
|---|---|
| Duda | 85% |
| TYPO3 | 79% |
| Wix | 74% |
| Weebly | 47% |
| WordPress | 45% |
It is the element being timed on 76% of mobile pages (HTTP Archive, 2025). Serve it at the size it displays, in a modern format, and do not defer it.
98.1% of pages request at least one JavaScript file (HTTP Archive, 2025). Chat widgets, pixels and embeds are usually the part you can delay.
62% of mobile pages leave at least one image without dimensions, which is what makes text jump while somebody is reading it.
The failure is weight and ordering, not the fact that a page is assembled on request. See what a dynamic website is.
What do you fix first?
The largest element above the fold, then the bytes, then the measurement again at the 75th percentile. The order is what moves the number.
- 01Find the element being timedLoad your own page on a phone and identify the largest thing on the first screen. On most sites it is one image or one heading.
- 02Serve that image properlyAt the dimensions it actually displays, in a modern format, loaded straight away. Lazy-loading the first image delays the exact thing being measured.
- 03Cut or delay third-party scriptsEvery widget is a request the page waits on. Keep what the first screen needs and postpone the rest.
- 04Set width and height on every imageOr an aspect-ratio. This is the layout-shift fix and it costs one attribute per image.
- 05Measure again on real trafficAt the 75th percentile over 28 days, not a single run. One fast test on an office connection is not the number Google reads.
Measure on a phone, on real visits, before you buy a redesign. These three numbers say whether the page is fast enough. Whether it asks for the call is a different check.
- 01Measure on a phone
- 02Fix the largest element
- 03Cut the bytes
- 04Re-measure at the 75th percentile
Questions owners ask
How fast should a website load?
Main content within 2.5 seconds, a response to a tap within 200 milliseconds, and layout movement under 0.1, for at least 75% of real visits. Those are Google’s published thresholds. On mobile, 48% of sites clear all three (HTTP Archive, 2025).
Why is my site fast on my laptop and slow on a phone?
Different hardware and network, and the two are scored separately. 74% of desktop sites meet the load threshold against 62% on mobile, and poor loads are nearly double on mobile: 13% against 7% (HTTP Archive, 2025).
What slows a service business page down most?
Weight, and mostly images. The median mobile home page ships 911 KB of images and 632 KB of JavaScript, and the element being timed is an image on 76% of mobile pages (HTTP Archive, 2025).
Does page speed decide my Google ranking?
Not on its own. The three numbers are user-experience thresholds, not a ranking formula: they define what fast enough means for the visitor. Clear them as a floor, then check whether the page actually asks for the call.
Sources
- Google, web-vitals library v6.2.3: the three Core Web Vitals thresholds as source constants in src/onLCP.ts, src/onINP.ts and src/onCLS.ts (read from a clone of the library's public repository on October 15, 2026; the rendered documentation page was not opened) (2026)
- HTTP Archive, Web Almanac 2025, Performance chapter (Chrome UX Report plus crawl, July 2025, millions of websites; read from a clone of the Almanac's public content repository, src/content/en/2025/performance.md) (2025)
- HTTP Archive, Web Almanac 2025, Page Weight chapter (same July 2025 crawl; page-weight bands measured against CrUX at URL level, src/content/en/2025/page-weight.md) (2025)
- HTTP Archive, Web Almanac 2025, CMS chapter (CrUX, July 2025; five of the ten platforms charted are quoted here, src/content/en/2025/cms.md) (2025)
The first meeting starts with findings, not promises.The free Business Health Report reads your business and shows you what it found, in days.
Get Your Free Business Health Report